Pressing Intensity Stats Explained: PPDA, High Turnovers and What They Really Mean
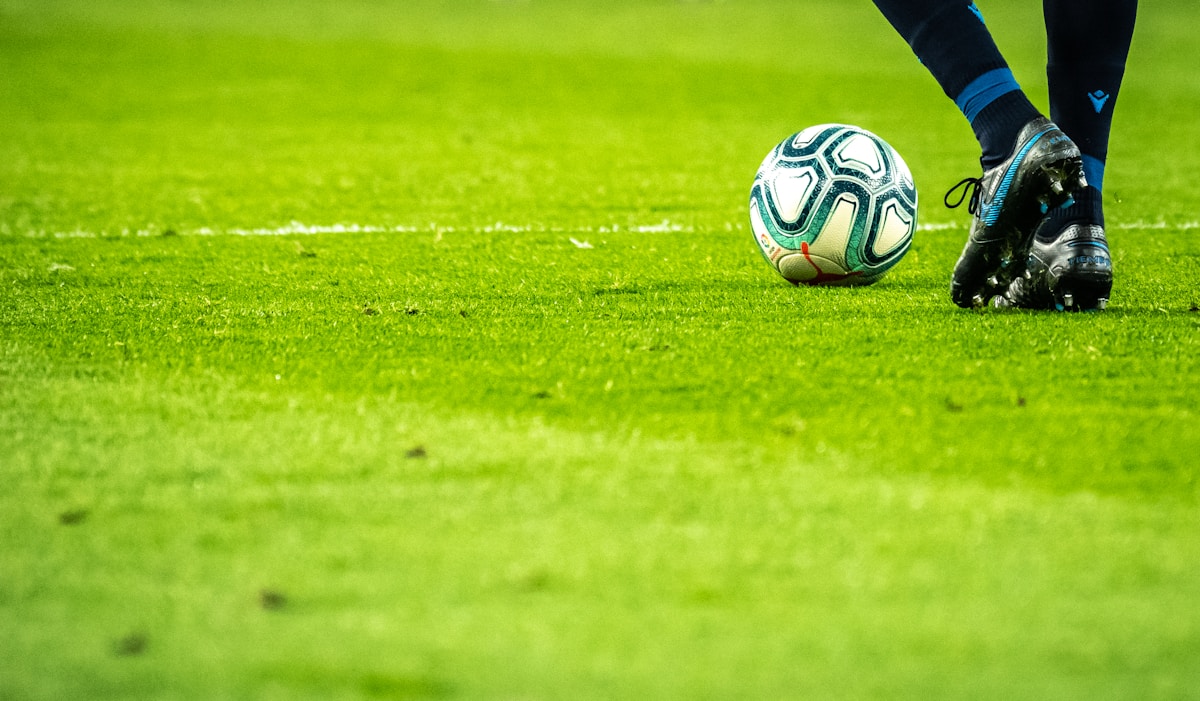
- Primary Signal: Pressing Intensity Stats Explained: PPDA, High Turnovers and What They Really Mean
- Overview: PPDA and high turnovers promise to measure pressing, but they are easy to misread. This guide explains what each stat counts, what good numbers look like, and their limits....
- Verification: Analyzed and compiled by 2026 Football Online editorial monitoring desk.
Every discussion of modern pressing eventually reaches the same stat: PPDA, or passes per defensive action, presented as a single number that supposedly tells you how hard a team presses. Lower is more intense, higher is more passive, and that simplicity is exactly why the stat is both popular and frequently misunderstood. PPDA counts how many passes an opponent completes in a defined area before the pressing team makes a defensive action such as a tackle, interception, or foul. A team with a PPDA of 8 allows eight opponent passes per defensive action, while a team at 14 allows nearly twice as many. The number is useful, but only when you understand what it measures, what it ignores, and which companion stats complete the picture.
PPDA is usually calculated in the opposition's defensive and middle thirds, or sometimes only in the final 60 percent of the pitch, because counting the whole pitch would reward teams that chase aimlessly in their own half. The formula divides opponent passes in that zone by the pressing team's tackles, interceptions, challenges, and fouls in the same zone. That construction explains both its strength and its weakness: it captures territorial aggression, but it treats a wild lunge and a perfectly timed interception as equal actions. It also says nothing about whether the press actually wins the ball, which is why analysts pair PPDA with high turnovers, the number of times a team regains possession within 40 metres of the opponent's goal. A side can have an intense PPDA yet few high turnovers if its press is energetic but poorly coordinated, a classic sign of pressing without a plan.
In top leagues, the most aggressive pressing sides typically post PPDA figures between 7 and 10, while deep, compact sides sit between 13 and 17. The gap sounds small but represents a huge difference in how much time opponents get on the ball. High turnovers add the payoff: elite pressing teams average five or more per match, and the best convert a meaningful share into shots within 15 seconds of the regain. Shot-ending high turnovers are the gold standard, because they connect the press directly to chance creation. Context is essential, though: a team that leads often will press less as it protects the result, so its season PPDA flatters its passivity, while a team chasing games presses more desperately. Analysts therefore split pressing stats by game state, looking at PPDA when scores are level to get the cleanest read on a team's true intent.
PPDA can be gamed by game plan in ways that fool a quick glance. A team facing a side that plays long balls will record a low PPDA, because long balls produce fewer completed passes before a defensive action, even if no real press exists. Conversely, a team pressing a possession monster may record a high PPDA simply because the opponent is too good to be rushed, not because the press is lazy. Mid-blocks are another trap: a side sitting in a compact mid-block may allow passes in harmless wide areas while springing traps centrally, producing a mediocre PPDA alongside excellent defensive results. The stat also ignores pressing quality entirely, such as whether the press forces the ball where the coach wants it or merely chases shadows. Smart readers therefore treat PPDA as a starting question, asking what the press is designed to achieve, rather than as a league table of effort.
The best pressing analysis combines PPDA with at least three companion measures. First, high turnovers and shots from high turnovers show whether the press creates danger or just burns energy. Second, opponent pass completion under pressure reveals whether the press actually disrupts build-up, since a press that allows 90 percent completion is decoration. Third, defensive distance and the height of the defensive line show where the press starts, because a high line with a mid-block press is a different animal from a genuine high press. Video completes the picture: watch whether the forwards press in coordinated arcs that cut off passing lanes, or whether they chase the ball carrier one at a time. The teams that press best are rarely the ones running the most; they are the ones running together, at the right moment, toward the same trap.
📖 Continue Reading the Full Story
Continue reading this article on 2026 Football Online.
⚡ Access Full Content NowMore from 2026 Football Online

 ⚽ SportsBet Insights Live
Case Study & Analysis: Calculadora de Parlay — Odds Combinadas e Prêmios (Day 19 Guide)
Real-world results and lessons from Calculadora de Parlay — Odds Combinadas e Prêmios on SportsBet Insights Li...
📋 Football2026 Tactics
2026 Industry Analysis: Calculadora de Parlay — Odds Combinadas y Premios (Day 3 Guide)
Why experts rely on Calculadora de Parlay — Odds Combinadas y Premios on Football2026 Tactics. Discover essent...
⚡ Soccer2026 LiveWire
Case Study & Analysis: Parlay Calculator — Gecombineerde Odds en Uitbetaling (Day 19 Guide)
Real-world results and lessons from Parlay Calculator — Gecombineerde Odds en Uitbetaling on Soccer2026 LiveWi...
📈 FootballBet Center
2026 Industry Analysis: Parlay Calculator — Gecombineerde Odds en Uitbetaling (Day 3 Guide)
Why experts rely on Parlay Calculator — Gecombineerde Odds en Uitbetaling on FootballBet Center. Discover esse...